Automatic Updates for Live Data
Learn how to automate uploading new data, changing metadata and republishing charts.
Datawrapper is great for static and dynamic data. In this tutorial, we will write a script that can automatically load current stock data, update and publish a visualization. All without touching a browser.
You can already use Datawrapper's "External dataset" feature to use live updating data. This is great as long as you only want the data to get updated. If you want to have a note in your chart that describes the last time you updated the chart, you have to do that yourself. Using the API will allow you to automate this step too!
See the scriptAre you a developer or do you want to see the code?
Follow this link to check it out:
https://github.com/datawrapper/snippets

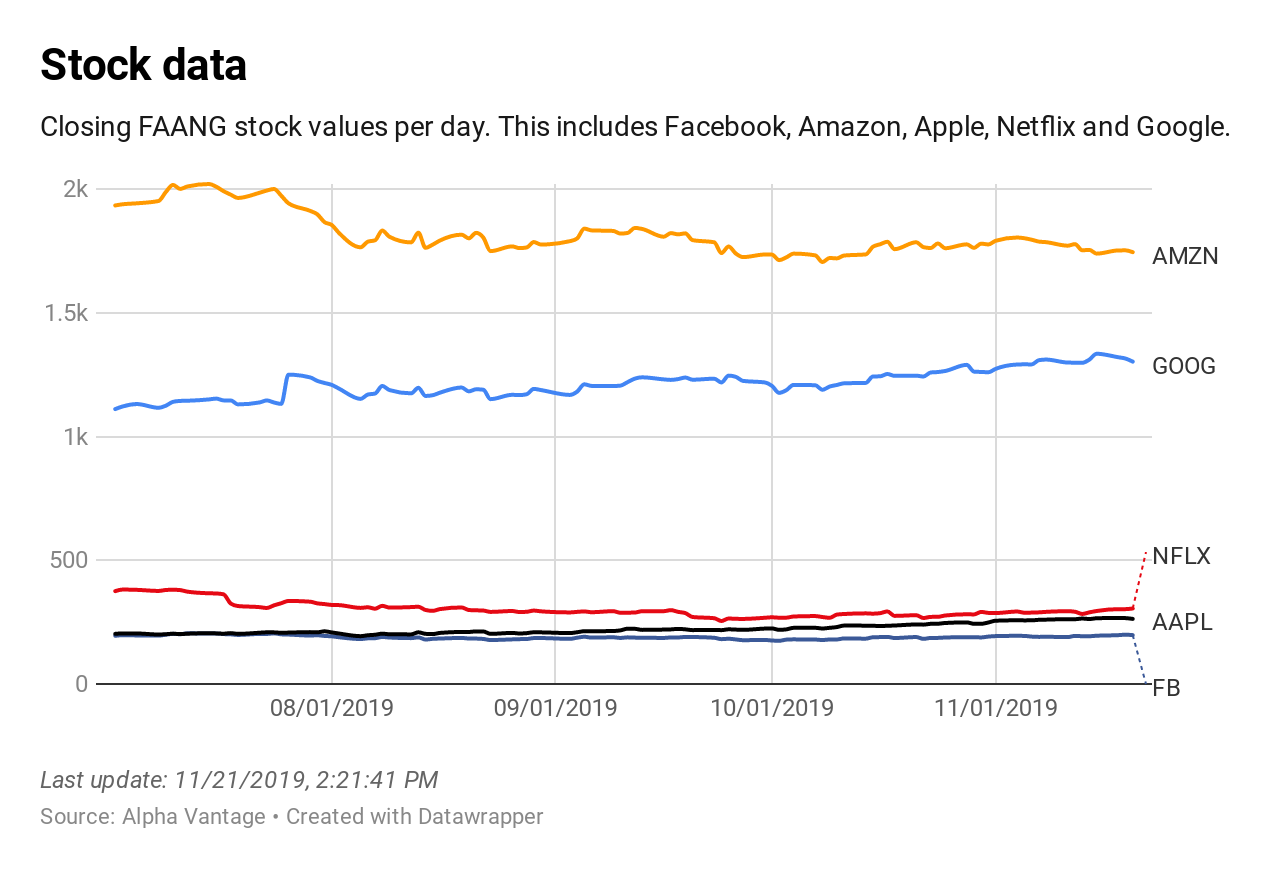
Chart with stock data and "Last update" time stamp.
The chart you see above is available here: https://www.datawrapper.de/_/AYB0f/.
1. Updating your Chart Data
Since we want to have full control when the chart data gets updated, we won't use the "External data" feature. First you need a way to get new data. This can come from a file, an external API or a Google Sheet. In this example we use https://www.alphavantage.co/ to load stock data of FAANG (Facebook, Amazon, Apple, Netflix, Google) stocks. You can get a free API key and check out their documentation here: https://www.alphavantage.co/documentation/. I'm going to use got from npmjs.org to make HTTP requests with Node.js.
const got = require('got')

/*
Utility function to not repeat all that code multiple times.
Make sure to replace API_KEY with your Alpha Vantage API key.
*/
function api(stock) {
  return got('/', {
    json: true,
    baseUrl: 'https://www.alphavantage.co/query',
    query: new URLSearchParams([
      ['apikey', API_KEY],
      ['function', 'TIME_SERIES_DAILY'],
      ['symbol', stock],
      ['interval', '1min'],
      ['datatype', 'json']
    ])
  })
}

const stockResponses = await Promise.all([
  api('FB'),
  api('AMZN'),
  api('APPL'),
  api('NFLX'),
  api('GOOG')
])
This code will make 5 HTTP requests to Alpha Vantages API and return the stock data. To upload this data with the Datawrapper API, it needs to get converted to CSV. Check out this script to see how this can be done. The code isn't included in this tutorial since it's not relevant for this concept.
2. Upload data to Datawrapper
Ok, you have transformed your data or copied the code from Github. Now, let's upload it to Datawrapper:
const got = require('got')

/*
getStockData() is a function that loads stock data
from external data source in CSV format
*/
const data = getStockData()

const dataResponse = await got(
  `https://api.datawrapper.de/v3/charts/${CHART_ID}/data`,
  {
    method: 'PUT',
    headers: {
      authorization: `Bearer ${DW_TOKEN}`
    },
    body: data
  }
)

/* A successful response will have status code 204 */
console.log(dataResponse.statusCode) // 204
Don't forget to insert your chart ID and Datawrapper API token. After uploading our new data, we need to update the chart note - the text where it says:
"Last update: 11/21/2019, 2:21:41 PM"
3. Change Update Timestamp
const got = require('got')

const chartResponse = await got(
  `https://api.datawrapper.de/v3/charts/${CHART_ID}`,
  {
    method: 'PATCH',
    json: true,
    headers: {
      authorization: `Bearer ${DW_TOKEN}`
    },
    body: {
      metadata: {
        annotate: {
          // Update with the current date and time
          notes: `Last update: ${new Date().toLocaleString()}`
        }
      }
    }
  }
)

/*
A successful response will have status code 200,
Check that `metadata.annotate.notes` got updated:
*/
console.log(dataResponse.statusCode)
// 200
console.log(dataResponse.body.metadata.annotate.notes)
// Last update: 11/21/2019, 2:30:00 PM`
4. Publish your Chart
That's it, there is now only 1 step left - to publish the chart:
const got = require('got')

const publishResponse = await got(
  `https://api.datawrapper.de/charts/${CHART_ID}/publish`,
  {
    method: 'POST',
    json: true,
    headers: {
      authorization: `Bearer ${DW_TOKEN}`
    }
  }
)

// This takes a few seconds

// Check the `publicUrl` and open your newly updated chart
console.log(publishResponse.body.data.publicUrl)
// https://datawrapper.dwcdn.net/CHART_ID/1/
Amazing, you just updated and published a chart without using the browser.
https://datawrapper.dwcdn.net/CHART_ID/1/
This is just the beginning. Automation doesn't have to stop here. A next step could be to run this script every day with a cron job on your server. You can even create an IFTTT rule or a Siri Shortcut to tell your Google Assistant or Siri to update a chart. How cool would it be to tell your phone "Hey Siri, please update my chart!" and it will happen automatically.
Don't worry if this seems complicatedIf this tutorial is overwhelming for you, let us know! You can reach us via email at [email protected] or on Twitter (@datawrapper). We are always happy to help.
Updated 8 months ago
