Let Others Create Datawrapper Visualizations From Presets

If you're running a website that hosts data and you want to allow your users to easily create a Datawrapper visualization, you can let your website visitors create Datawrapper charts, maps, and tables from a preset.
This feature is completely free – you don't even need to be a Datawrapper user to provide this option on your website.
How to implement the feature on your website
The "Create a Datawrapper chart with this data" button on your website is actually a form that you pre-fill with the data, visualization settings, title, source, etc.
There are many ways to create a form. We prepared a demo of a JavaScript version and a simple HTML form. Here's a step by step guide:
- Place a form on your website where the
methodisPOST. Theactionneeds to behttps://app.datawrapper.de/create/. - Use the form fields to pass the data (like title, chart type, and data) to our server. You probably want to hide these fields, so set your
typetohidden. These are all the available options:title,description,aria_description,type,theme,source_name,source_url,notes,byline,language,last_edit_step,metadata,data, andexternal_data. - Add a submit button to your form by adding (in the HTML version)
<input type="submit" value="Create visualization" />
And that's it! To learn more about how to create HTML forms, we recommend this Mozilla article.
Here's an example of such an HTML form:
<form method="POST" target="_blank" action="https://app.datawrapper.de/create/">
    <input type="text" name="type" value="d3-lines" />
    <input name="title" type="text" value="This is the chart title" />
    <input name="description" type="text" value="Some more text to go below the headline" />
    <input name="source_name" type="text" value="Apple" />
    <input type="submit" value="Create a Datawrapper chart with this data" />
    <textarea name="data">Quarter;iPhone;iPad;Mac;iPod
Q3 2000;;;1.1;
Q4 2000;;;0.6;
Q1 2001;;;0.7;
Q2 2001;;;0.8;
    </textarea>
</form>
You can decide how many visualization settings you want to add to your form. If you don't input e.g. a title, they also won't appear on the confirmation page.
You can also set more advanced metadata settings like the color of your bars, but they won't appear on the confirmation page.
How many settings should you add?To make sure the Datawrapper interface works nicely for visualizations created with this preset feature we recommend adding as few metadata settings as necessary – or to send the complete metadata. Learn here how to get the complete metadata of a chart, map, or table with our Datawrapper API.
Assigning columns to chart settings
Datawrapper will also automatically try to assign the best possible column to your x or y axes based on the column type. But you can also assign the columns of your data sets by hand.
Let's take bar charts as an example: You can use...
metadata.axes.barsto define which column should be used for the bar valuesmetadata.axes.colorsto set the column you want the bars to be colored by
Here's a full list of possible metadata.axes settings:
Assigning columns to symbol and choropleth maps settings
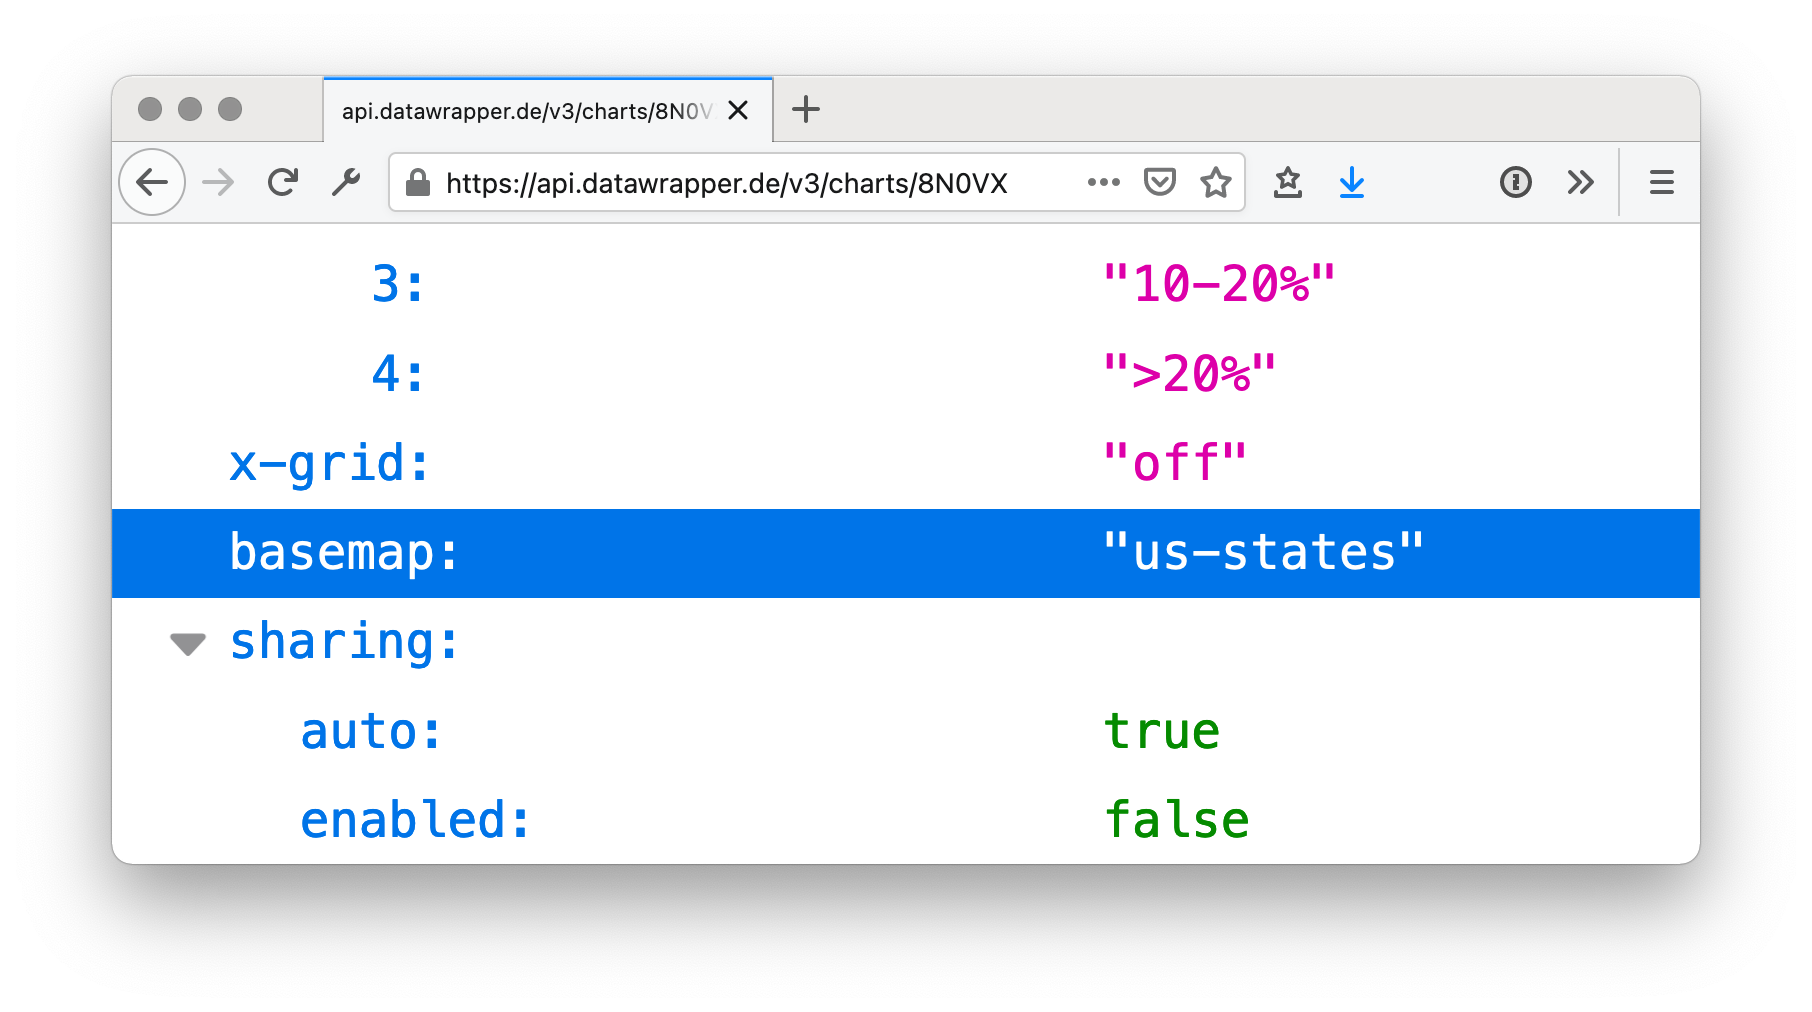
If you let your website visitors create choropleth and symbol maps, you need to set the basemap ID with metadata.visualize.basemap. To get the basemap ID, create a map with the right basemap (=administrative regions like "World" or "US counties"), then use the API to get the map properties. Here's how to do this.
For example, the map with the ID 8N0VX uses a basemap with the basemap ID us-states: https://api.datawrapper.de/v3/charts/8N0VX.
You can find an example for both a symbol and choropleth map preset at the bottom of this demo page.
Here are all the metadata.axis settings you can set in choropleth and symbol maps:
Live-updating visualizations
You can set a visualization preset with updating data. Simply provide an URL as external_data instead of passing a CSV dataset via data. Find an example at the bottom of this demo page.
What your website visitors will see
Your website visitors will see a button that invites them to create a Datawrapper chart, map, or table with the data you show on your page (e.g. "Create a Datawrapper chart with this data").
Once clicked, your visitors will come to a page that lets them confirm your suggested visualization settings, title, notes, etc. (if you gave some). It will also show your visitors the data set again.
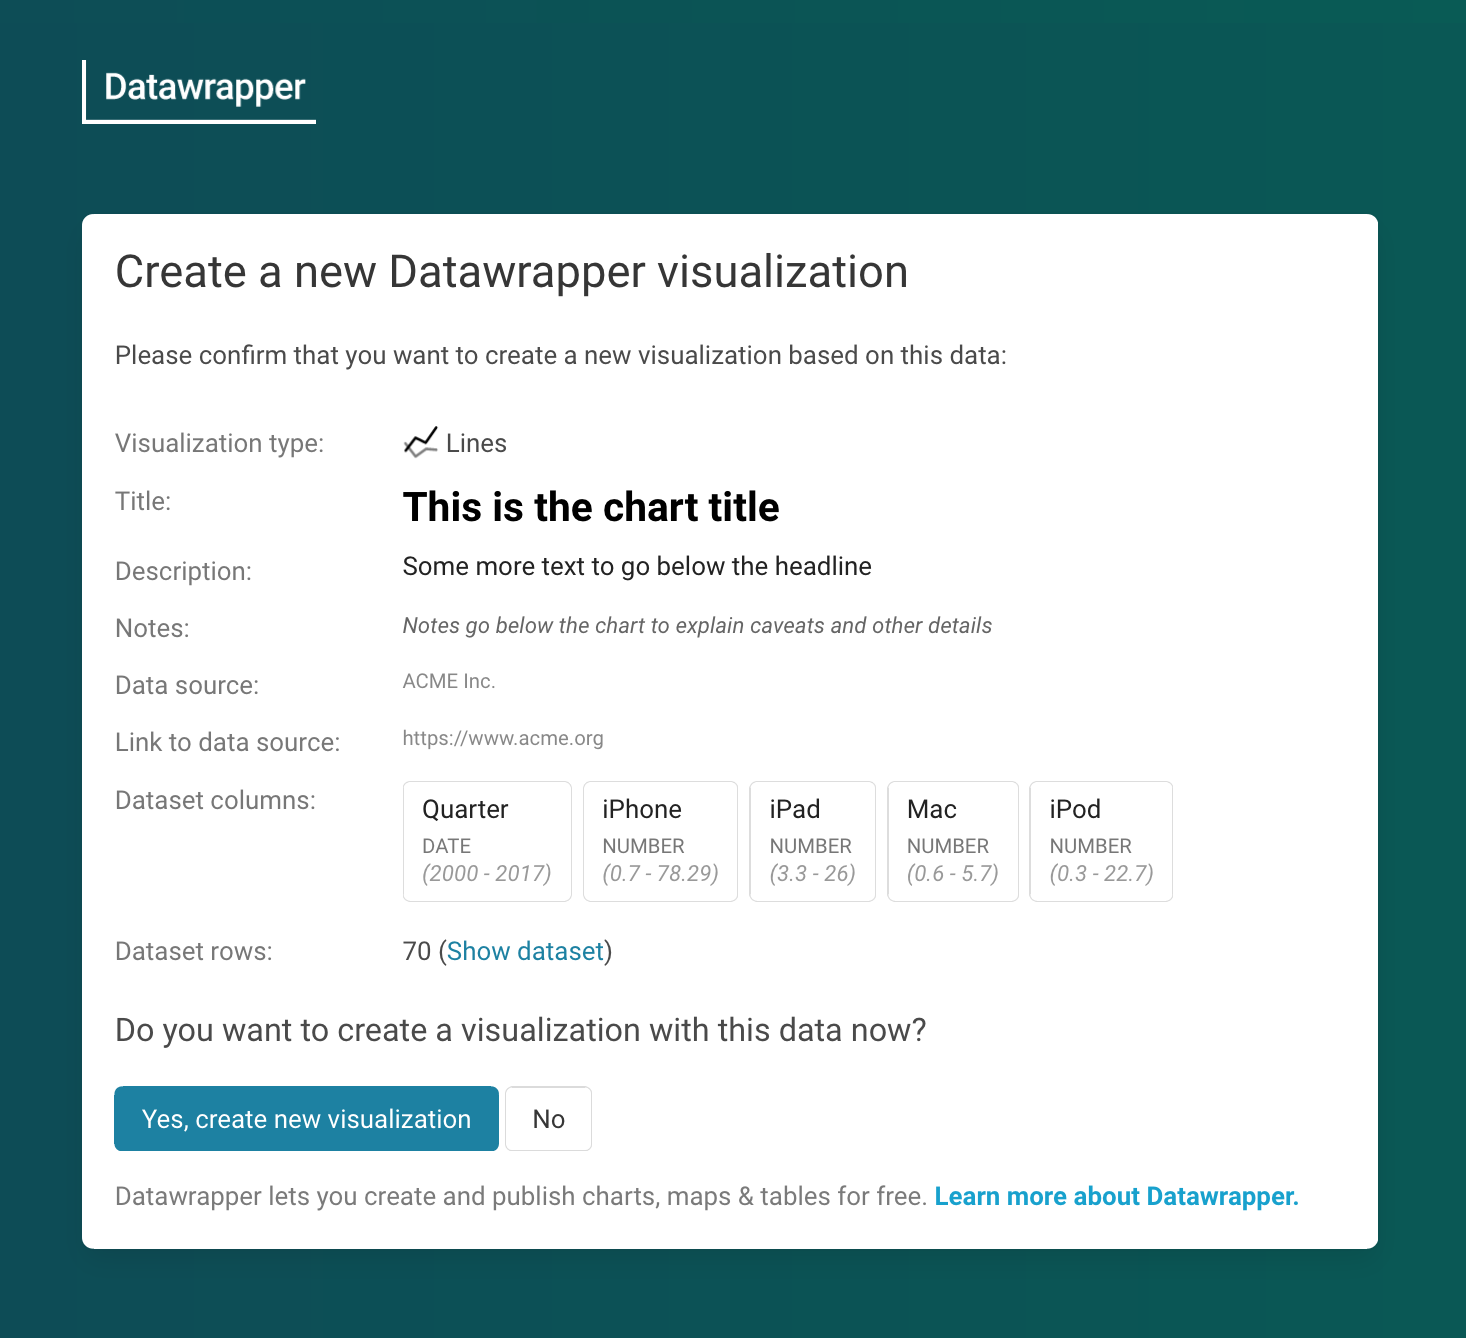
They can then click on "Yes, create new visualization" to land directly in step 3: Visualize.
Your visitors will be able to change all your suggested visualization settings, like the title or chart type. They can also go back to step 1: Upload data or step 2: Check & Describe to change the data.
If they're a logged into Datawrapper, the visualization gets created in the visitor's default team and can simply be published in step 4: Publish. If they're not Datawrapper users yet, they will see a "Leave your email address and we'll send you the embed code" message in step 4.
Updated about 1 year ago