Custom embed code
How to set up a custom embed code template in Datawrapper
What is a Custom Embed Code?
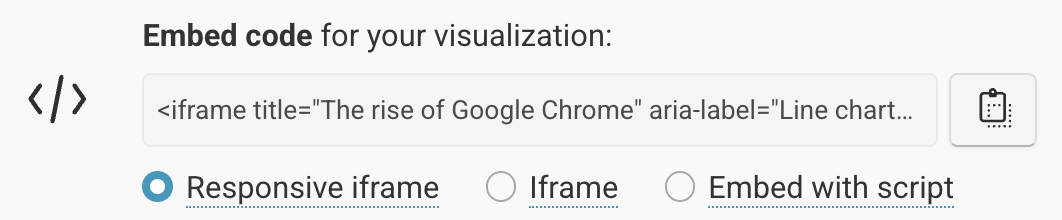
By default, Datawrapper provides three embed code templates, the responsive iframe, the iframe, and the script embed.
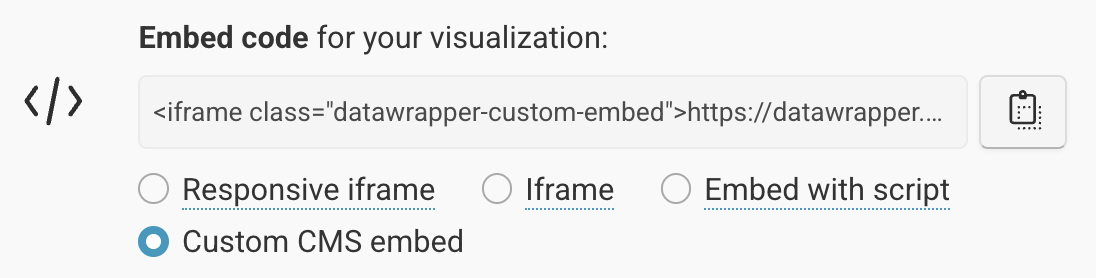
In case neither of these suite your needs exactly, Datawrapper offers the option to define a custom embed code, that will become available in addition to the three standard options when publishing visualizations.
This can be useful if for example if you need to include some special CSS classes, or if you'd like to provide a quick and easy way to copy just the visualization's ID, to be processed in a manner of your choosing by your CMS.
How to configure a custom embed code template
1. Prerequisites
Custom embed code templates are a workspace/team feature. To configure a custom embed code template, you'll need to be either an admin or the manager of the workspace or team. See here for a guide on managing your workspace, including setting roles.
2. Navigate to your Preferences overview page
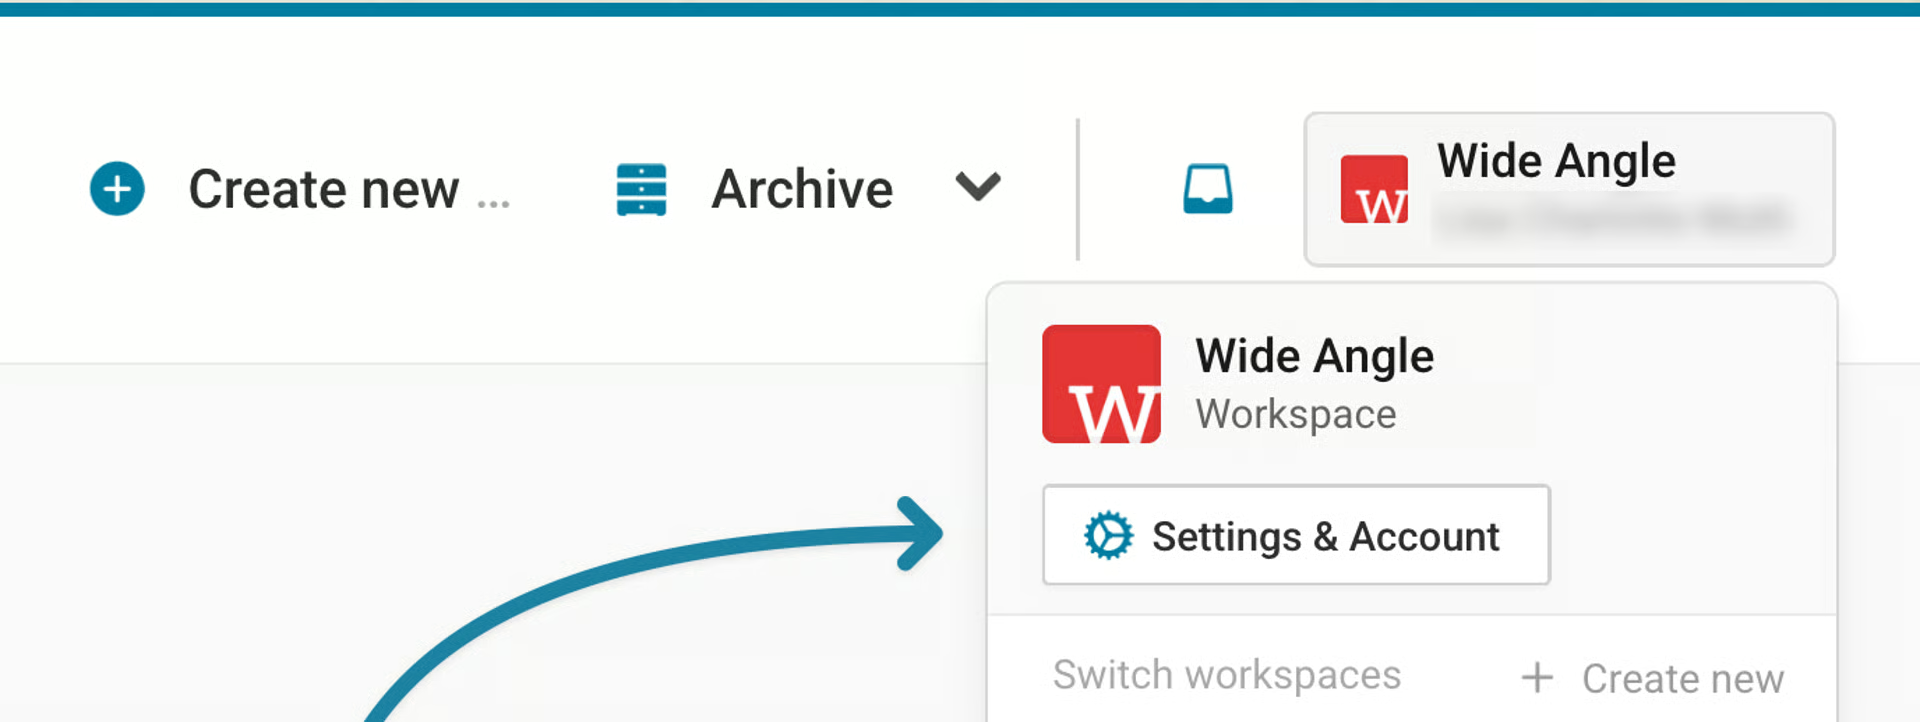
The custom embed code is configured via the Preferences page for your workspace or team. This can be found at the following URL app.datawrapper.de/settings/preferences. Alternatively, you can navigate to this page via the workspace dropdown in the toolbar: first by clicking on the Settings & Account button and then selecting Preferences for your workspace or team in the left sidebar.
3. Configure your custom embed template
In the Default settings for new visualizations section of your workspace's or team's preferences, you have the option to select the default embed code.
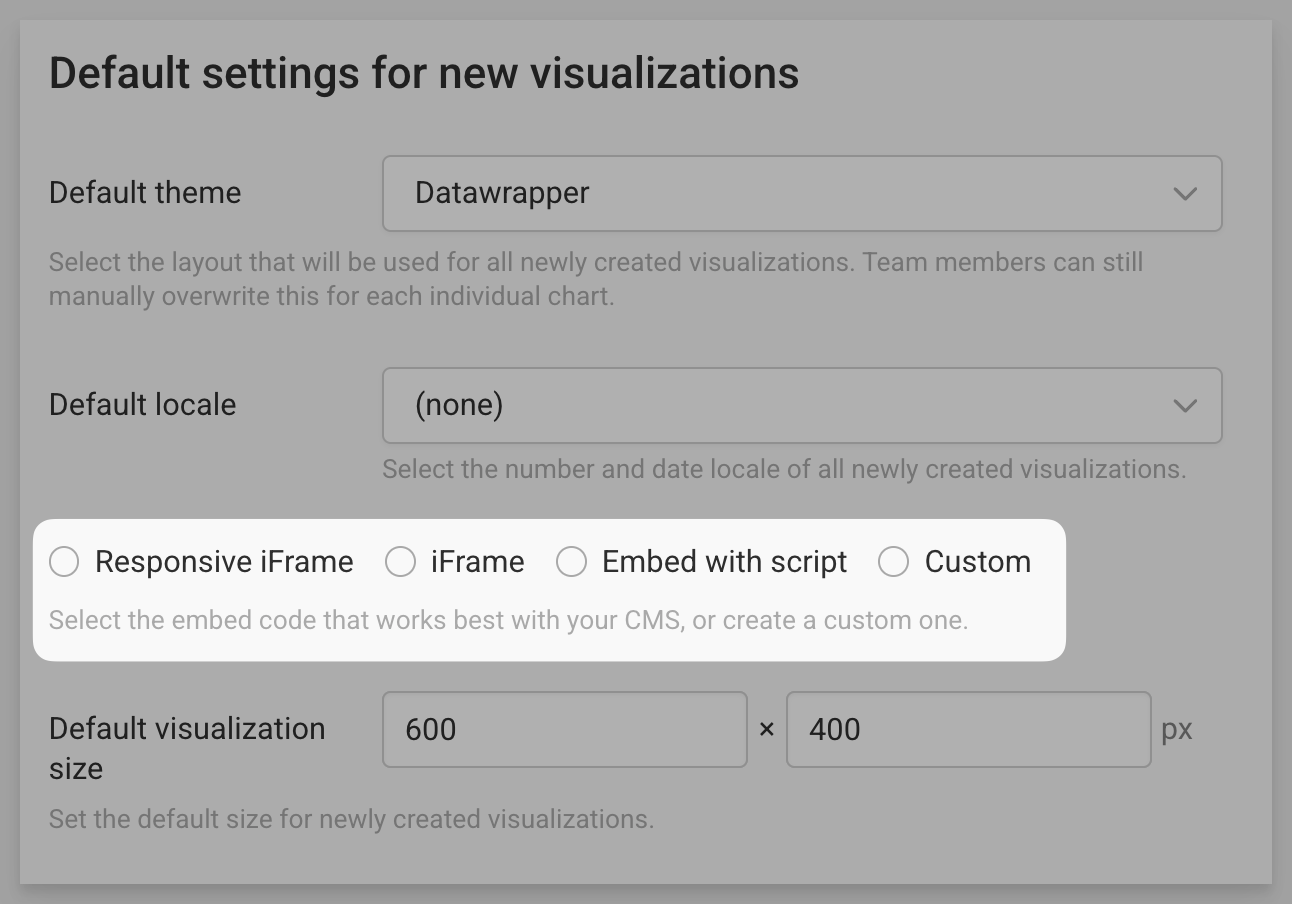
Select Custom to open up the configuration options for the custom embed code template.
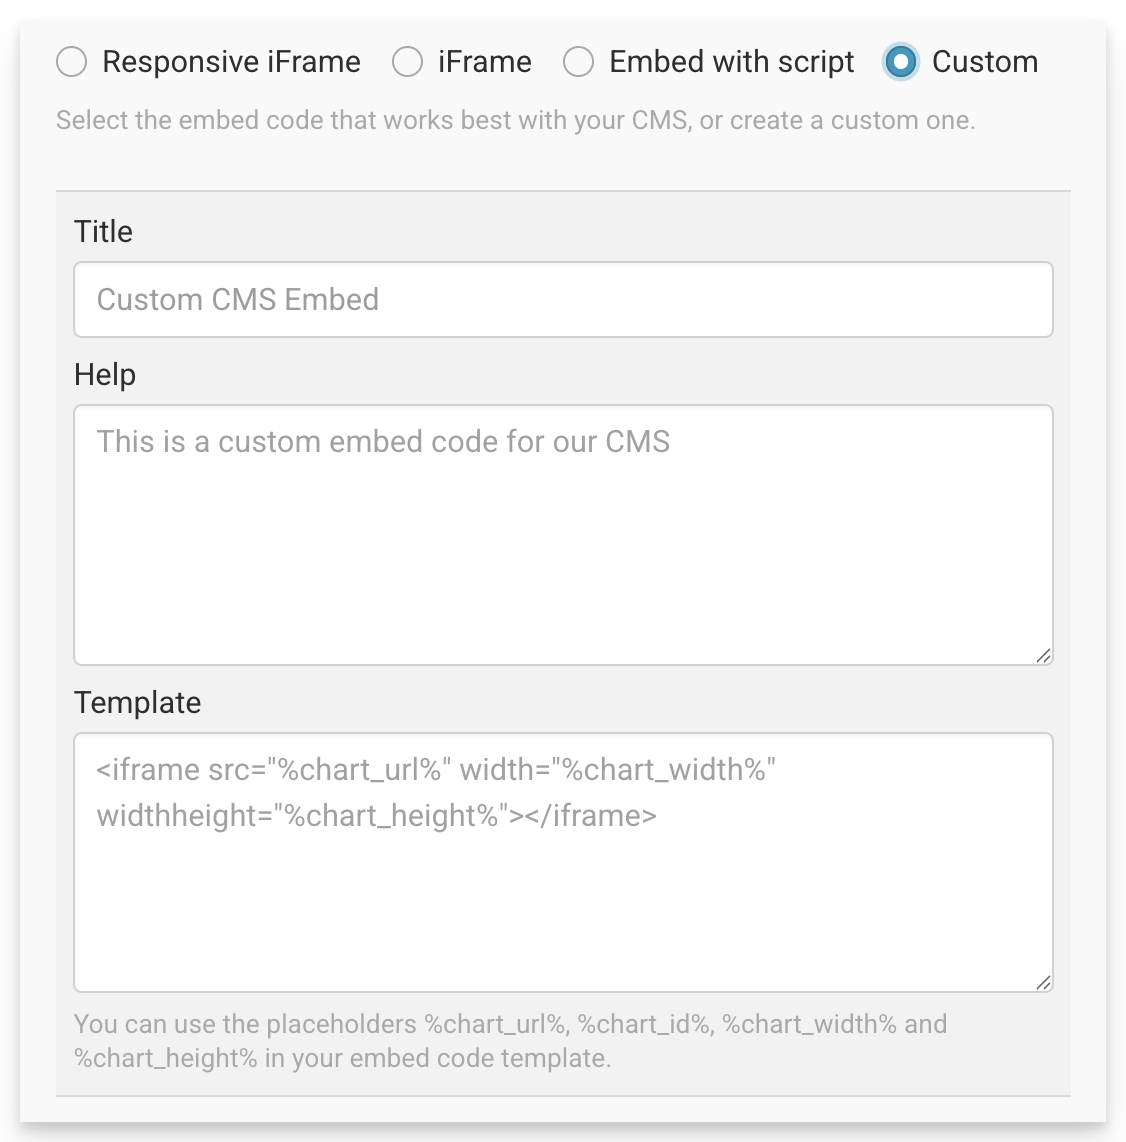
Custom embed code configuration options
| Configuration option | Purpose |
|---|---|
| Title | How the custom embed option will appear in the UI. |
| Help | Extra information shown in the Publish UI to clarify purpose of embed code. (optional) |
| Template | This defines the markup of your custom embed code, and is constructed using placeholders for the visulalization's properties. |
Constructing the embed code template
The embed template itself is constructed using predefined placeholders for the visualization's properties, such as its URL (%chart_url%) and ID (%chart_id%). A full documentation of available placeholders can be found below.
Constructed using these placeholders, a standard iframe embed code template might look something like this:
Tip: Modify our default templatesYou may only need to make a small adjustment to one of our default embed codes. In that case, we recommend taking one of our default embed templates as a starting point.
Once the custom embed code has been configured, it will become available for all visualizations within the team. Note that visualizations that are already published will need to be republished, for the new embed code to be generated.
Embed code placeholders
All placeholders available for use in the the embed code template are referenced and explained in the following table.
| Template placeholder | Purpose | Example |
|---|---|---|
| %chart_id% | The visualization's unique ID | OaEnQ |
| %chart_public_version% | Indicates the number of times that a visualization has been published. | 2 |
| %chart_url% | The visualization's URL. This would be the src of your iframe. Note that this includes the visualization's public version. | https://datawrapper.dwcdn.net/OaEnQ/2/ |
| %chart_url_without_version% | The visualization's URL, without the appended version number | https://datawrapper.dwcdn.net/OaEnQ/ |
| %chart_url_without_protocol% | A protocol-less version of the visualization's URL | //datawrapper.dwcdn.net/OaEnQ/2/ |
| %chart_type% | The visualization type | Interactive line chart |
| %chart_title% | The visulization's title | Voter turnout at latest elections in Europe |
| %chart_intro% | The visualization's description | Countries with a higher turnout (green) and a lower turnout (red) than the EU28 average (68%) at their last national elections. |
| %embed_js% | JS snippet that is responsible for the responsive resizing of embeds. This is identical for every visualization. | See documentation here |
| %chart_width% | The width of the visualization, when it was last published. | 500 |
| %chart_height% | The height of the visualization, when it was last published. | 600 |
| %aria_description% | The visualization's alternative description, if configured, otherwise the chart title and type. | A line chart showing the price history in USD/kWh for different renewable energies and fossil fuels from 2010 to 2023. In 2020, solar energy became cheaper than fossil fuels. |
| %aria_description_long_fallback% | The visualization's alternative description, if configured, otherwise the chart title, description, and type. | A line chart showing the price history in USD/kWh for different renewable energies and fossil fuels from 2010 to 2023. In 2020, solar energy became cheaper than fossil fuels. |
Default embed templates
Use our standard embed templates as a starting point for your own custom embed code.
Responsive iframe
This embed code ensures that embedded visualizations dynamically adjust to the dimensions of the device that they are being accessed from. See our full documentation here, for further details.
<iframe title="%chart_title%" aria-label="%chart_type%" id="datawrapper-chart-%chart_id%" src="%chart_url%" scrolling="no" frameborder="0" style="width: 0; min-width: 100% !important; border: none;" height="%chart_height%"></iframe><script type="text/javascript">%embed_js%</script>Iframe
Using this embed code, embedded visualizations will have a fixed width and height, defined as they were when the visualization was last published
<iframe title="%chart_title%" aria-label="%chart_type%" id="datawrapper-chart-%chart_id%" src="%chart_url%" scrolling="no" frameborder="0" style="border: none;" width="%chart_width%" height="%chart_height%"></iframe>Custom placeholders
For those on our Custom or Enterprise plans it is possible to configure additional custom fields in the Annotate section in the chart editor. These can also be inserted into a custom embed code via placeholder.
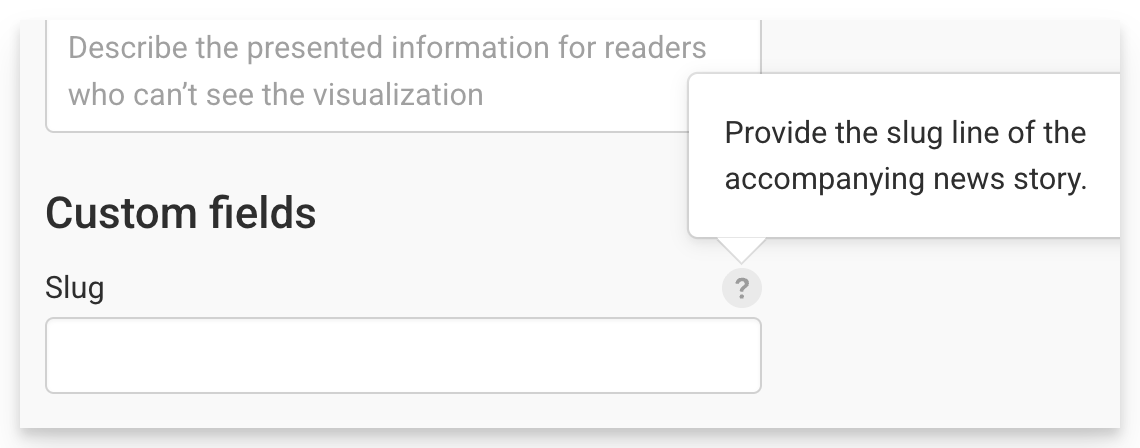
Example of a 'custom field' in the Datawrapper UI
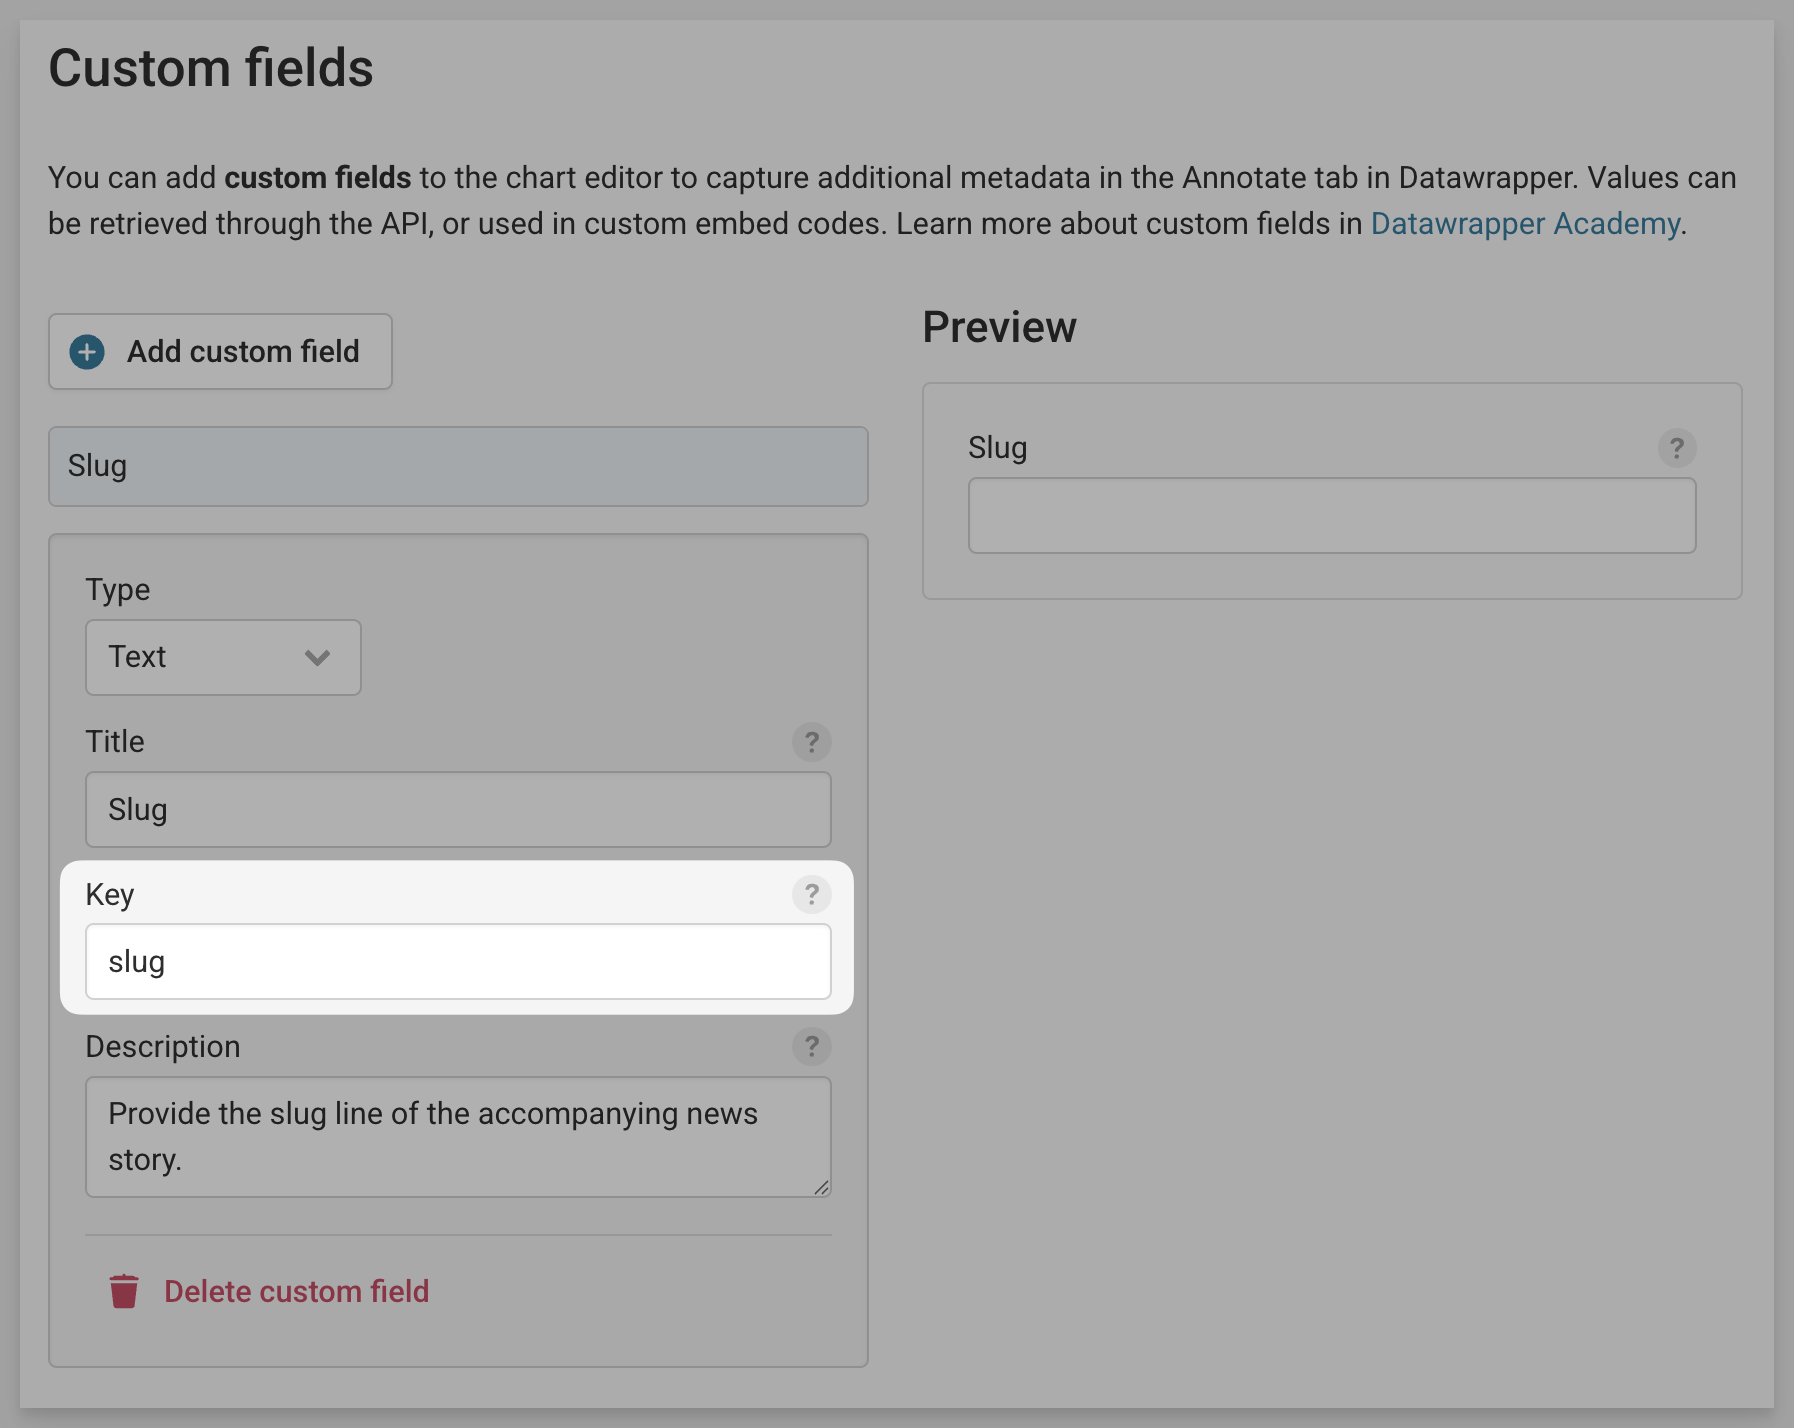
Setting up custom fieldsThe creation of custom fields is explained in detail here.
You can reference any custom field in your custom embed code via %custom_key% where the 'key' is the key you configured, when setting up the custom field. In this example, the placeholder would be %custom_slug%.
Updated 16 days ago