Script embed
How to embed Datawrapper visualizations without using iframes
To learn why you should consider embedding your Datawrapper visualizations with the script embed instead of iframes, read this feature announcement on our blog.
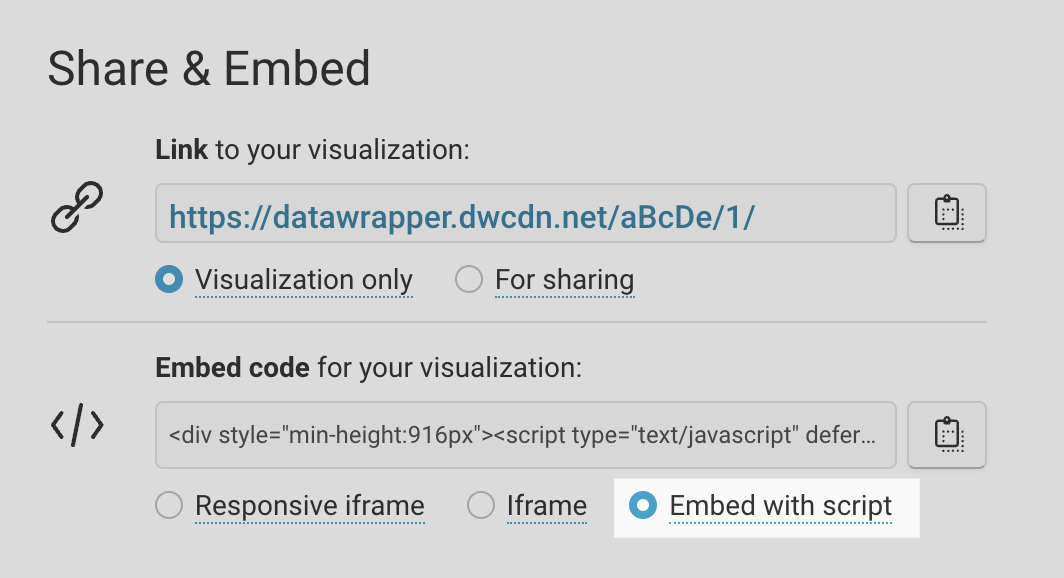
Datawrapper visualizations can be embedded as a web component, by using the Embed with script option that is provided in the Publish step once you have published your visualization:
To use the script embed code, simply copy & paste the script embed code into your website or CMS. Make sure to paste it into the actual code or HTML view in your article, not in the visual or text view.
Considerations when using the script embed
- Your CMS needs to allow the insertion of custom JavaScript into the main body of your article.
(In case this is not possible, a custom CMS solution can be implemented, see the section below onworking with JavaScript restrictions) - Visualizations last published before March 3rd, 2023 will need to be republished to become embeddable using the script embed option.
- If you use the self-hosting feature to publish your visualizations on a custom domain, you need to ensure that it supports CORS requests from the website in which you are embedding visualizations.
Browser support for web components is above 97%, however if a browser without web component support encounters a script embed, it will fall back to an iframe.
How the script embed code works
This is how a typical script embed code looks:
<div style="min-height:442px">
  <script type="text/javascript" defer src="https://datawrapper.dwcdn.net/aBcDe/embed.js" charset="utf-8"></script>
  <noscript><img src="https://datawrapper.dwcdn.net/aBcDe/full.png" alt="" /></noscript>
</div>
It consists of a JavaScript tag, wrapped in a <div>. The <script> will dynamically insert an embed of your visualization into its parent element (in the default case, that's the <div> included in the embed code) as a custom element called <datawrapper-visualization>.
Note that the embed code includes an image fallback in case the page is opened in a browser without JavaScript enabled.
How the script embed affects the embedding page
- The script tag will add a global
datawrapperobject to the window scope, which is used for sharing resources. Beyond that, it won't load or inject any external dependencies into the global scope of the embedding page. - Aside from inserting the custom element, the script won't make any DOM changes, with one exception: since custom elements can’t define their own web fonts, if the required fonts are not already loaded on the embedding page, they will be injected.
- Since the styles for the embedded visualization are encapsulated within the web component, they won’t affect the embedding website. Likewise, the styles on the embedding website won't 'leak' into the embed either.
Customizing the embed target
By default, the embed <script> will insert the visualization into its parent element, however this behaviour can be customized, by setting a data-target attribute on the <script>, that contains a CSS selector for the element into which the visualization should get rendered.
If there is a data-target set on the script, it will turn the first element it finds that matches the selector and hasn't already been used as an embed target, into the embed. If no such element is found, it will fall back on the default behaviour of rendering the visualization into its parent container.
How to enforce dark mode and configure other render options
Iframe embeds allow you to set certain render flags via query parameters, such as ?dark=true to enforce dark mode. The equivalent can be achieved with script embeds, by setting the flags as data attributes on the script tag. For example, to enforce both dark mode and for the logo to be displayed, the <script> tag can be modified as follows:
<script
    type="text/javascript" defer
    src="https://datawrapper.dwcdn.net/aBcDe/embed.js"
    data-dark="true" data-logo="on">
</script>
Linking to another visualization via <a target=“_self”>?
<a target=“_self”>?In visualizations embedded as an iframe, you can link to other visualizations that open within the same iframe using a trick we explained in our Academy here. This will also work out of the box with the script embed. These links will be automatically detected and load a different visualization into the same spot when they are clicked.
Working with JavaScript restrictions
How to insert arbitrary embeds with one global script
In some cases, Datawrapper's default script embed code may not be viable, e.g in a CMS that prevents the insertion of JavaScript into the article body for security reasons, or when embedding within another web component.
In such cases, a custom approach can be taken, that moves the embedding logic outside of the article body, and allows for programmatically inserting a Datawrapper embed into an arbitrary HTML element.
This can be achieved by loading the generic script that provides the utilities for rendering a Datawrapper web component embed, from https://datawrapper.dwcdn.net/lib/datawrapper.js.
Once that script is loaded and executed, a Datawrapper web component embed can be inserted via:
datawrapper.render(embedData, { target, flags });
where:
embedDatais a json specific to the visualization, that contains all its required render properties. It is available for every published chart at a URL following this pattern:https://datawrapper.dwcdn.net/CHART_ID/embed.json(replaceCHART_IDwith the visualization's id)- the
targetis the DOM element that should become the chart flagsis an object of optional render flags, see documentation
This allows for a custom CMS setup where the embedding logic is extracted to generic logic in e.g the <head> of the page, such that editors only need to insert HTML placeholders for the embeds into the article itself, which can be set up as a custom embed code.
Here's an example of how that could look:
Updated about 1 year ago