Creating a Chart

With Datawrapper, you can create more than 20 different chart types, like line charts, bar charts or pie charts. In this tutorial, you'll learn how to create a chart with the Datawrapper API, how to add data to it and how to edit the resulting chart.
You need an API Access TokenEverything you need to follow this tutorial is a Datawrapper account and an API Access Token. Both are available for free. You can create an API Access Token with the click of a button in your Datawrapper settings. Learn how to do so in this article.
Create a chart
Let's start with a short POST request to create our chart. To do so, we'll define the visualization type in the API request. Use this overview of Visualization Types to find out how the chart type you want to use is called in the API.
For example, to create a stacked bar chart, we need to define the type d3-bars-stacked. Let's add the title "Where do people live?" (defining the title is not necessary, but it can't hurt).
Put together, our API request looks like this:
curl --request POST \
     --url https://api.datawrapper.de/v3/charts \
     --header 'Authorization: Bearer <YOUR_TOKEN_HERE>' \
     --header 'content-type: application/json' \
     --data '{ "title": "Where do people live?", "type": "d3-bars-stacked" }'
That's it! We created a chart.
The query will return a response with some information about our locale, our author ID and the date & time when we created the chart:
{
  "title": "Where do people live?",
  "theme": "datawrapper",
  "type": "d3-bars-stacked",
  "language": "en-US",
  "authorId": 62982,
  "id": "BzFZ1",
  "lastEditStep": 3,
  "lastModifiedAt": "2019-11-08T17:22:37.824Z",
  "createdAt": "2019-11-08T17:22:37.824Z",
  "url": "/v3/charts/BzFZ1"
}
The most important information is the id. In our case, that's BzFZ1. We should remember this chart ID, because we will need it for many of our following API requests:
Always replace our sample ID BzFZ1 in this article with your actual chart id from your API response. If your chart id was th4ns, you'll need to insert that in the examples below every time you'll see the placeholder <ID> – otherwise, your requests won't work.
Upload data
Great, we have a new chart! But it's an empty chart, since we haven't defined any data yet that it should display. So let's upload some data.
We decided on some data about urban and rural populations from the [UN population division](source: https://esa.un.org/unpd/wup/CD-ROM/). After downloading the data, we cleaned it up and transformed it into a CSV (comma-separated values). In our case, we use semicolons instead of commas to separate our values, but both will work.
Again, don't forget to add your own chart ID and your own Bearer Token if you follow along.
curl --request PUT \
     --url https://api.datawrapper.de/v3/charts/`<ID>`/data \
     --header 'Authorization: Bearer <YOUR_TOKEN_HERE>' \
     --header 'content-type: text/csv' \
     --data 'country;Share of population that lives in the capital;in other urban areas;in rural areas
Iceland (Reykjavík);56.02;38;6
Argentina (Buenos Aires);34.95;56.6;8.4
Japan (Tokyo);29.52;63.5;7
UK (London);22.7;59.6;17.7
Denmark (Copenhagen);22.16;65.3;12.5
France (Paris);16.77;62.5;20.7
Russia (Moscow);8.39;65.5;26.1
Niger (Niamey);5.53;12.9;81.5
Germany (Berlin);4.35;70.7;24.9
India (Delhi);1.93;30.4;67.6
USA (Washington, D.C.);1.54;79.9;18.6
China (Beijing);1.4;53;45.6'
After running this query, you won't see any output in your terminal. This is a good thing. PUT requests don't return a response body when they are successful: You already know what the data is because you just sent it.
To make sure everything worked you can get the data with this request:
curl --request GET
--url https://api.datawrapper.de/v3/charts/<ID>/data
--header 'authorization: Bearer <YOUR_TOKEN_HERE>'
The response will be our data:
country;Share of population that lives in the capital;in other urban areas;in rural areas
Iceland (Reykjavík);56.02;38;6
Argentina (Buenos Aires);34.95;56.6;8.4
Japan (Tokyo);29.52;63.5;7
UK (London);22.7;59.6;17.7
Denmark (Copenhagen);22.16;65.3;12.5
France (Paris);16.77;62.5;20.7
Russia (Moscow);8.39;65.5;26.1
Niger (Niamey);5.53;12.9;81.5
Germany (Berlin);4.35;70.7;24.9
India (Delhi);1.93;30.4;67.6
USA (Washington, D.C.);1.54;79.9;18.6
To check if all of that actually worked, let's look at the created chart on datawrapper.de. To do that, head to https://datawrapper.de/chart/<ID>/visualize.
Edit the chart: Properties
Now we could already publish our chart (to do so, jump to the last section). But we can also add some settings to our chart before we do so, like a description and a source, or better colors.
To understand which settings are already set by default (and later by you), and what they're called, you can run the following GET query:
curl --request GET \
     --url https://api.datawrapper.de/v3/charts/`<ID>` \
     --header 'authorization: Bearer <YOUR_TOKEN_HERE>' \
The response will be a long JSON, like so:
{
  "id": "BzFZ1",
  "type": "d3-bars-stacked",
  "title": "Where do people live?",
  ...
  "metadata": {
    "data": {
      "transpose": false,
      "vertical-header": true,
      "horizontal-header": true
    },
    "publish": {
      "embed-width": 600,
      "chart-height": 321.859375,
      "embed-height": 390
    },
    "annotate": {
      "notes": ""
    },
    "describe": {
      "intro": "",
      "byline": "",
      "source-url": "",
      "source-name": "",
      "number-append": "",
      "number-format": "-",
      "number-divisor": 0,
      "number-prepend": ""
    },
    "visualize": {
      "rules": false,
      "thick": false,
      "sort-asc": true,
      "force-grid": false,
      "resort-bars": false,
      "block-labels": false,
      "tick-position": "top",
      "show-color-key": true,
      "label-alignment": "left",
      "value-label-row": false,
      "value-label-mode": "left",
      "custom-grid-lines": "",
      "date-label-format": "YYYY",
      "hide-group-labels": false,
      "stack-percentages": false,
      "highlighted-series": [],
      "highlighted-values": [],
      "value-label-format": "0,0.[00]",
      "value-label-visibility": "show"
    },
    "json_error": "Syntax error"
  },
  "language": "en-US",
  ...
}
We will define all these settings in the property metadata.
Edit the description
Let's use the following PATCH request to give the chart a proper description (="intro"), source and byline:
curl  --request PATCH \
      --url https://api.datawrapper.de/v3/charts/`<ID>` \
      --header 'Authorization: Bearer <YOUR_TOKEN_HERE>' \
	    --header 'content-type: application/json' \
      --data \
     '{
        "metadata": {
          "describe": {
              "source-name": "UN Population Division",
              "source-url": "https://population.un.org/wup/",
              "intro": "Share of population that lives in the capital, in urban areas and in rural areas, of selected countries, 2014.",
              "byline": "Lisa Charlotte Rost, Datawrapper"
          }
        }
    }'
"I got an error!"If you get the error
{"statusCode": 400, "error": "Bad Request", "message": "Invalid request payload input" }or something similar, it's likely that you didn't get the brackets and commas right in the JSON in your request. Make sure that you
- close all brackets that you open
- don't add commas after a closing bracket when it stands before another closing bracket
- don't add commas after the last property before a closing bracket
You can also use an online JSON validation tool to quickly check if your JSON is valid. An example of such a tool which is active at the time of writing this tutorial is JSON Checker.
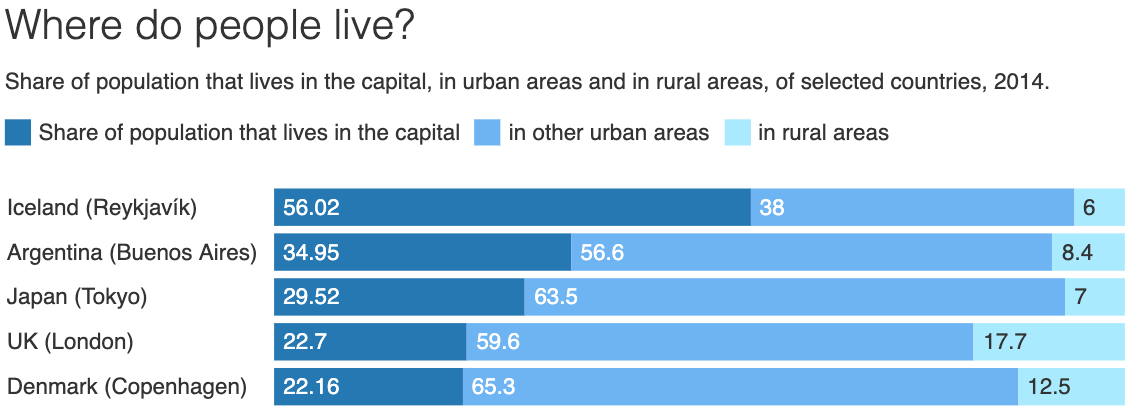
You will get the entire property JSON as a response, so you can check what changed. Our chart will now look like this:

We can add as many PATCH requests as we want to add or overwrite settings. Not all possible properties will be in the default JSON, so play around to find more:
Play around to find all metadata propertiesWe won't have the capacity to explain every single property within
metadatafor every single chart type. To learn the names of the properties (to then change them with API requests), consider creating a chart within the Datawrapper app. You can change settings there, and then pull the property information for this chart from the API to learn what the changed settings are called.
This is something we'll need to do when we want to change the colors:
Edit colors
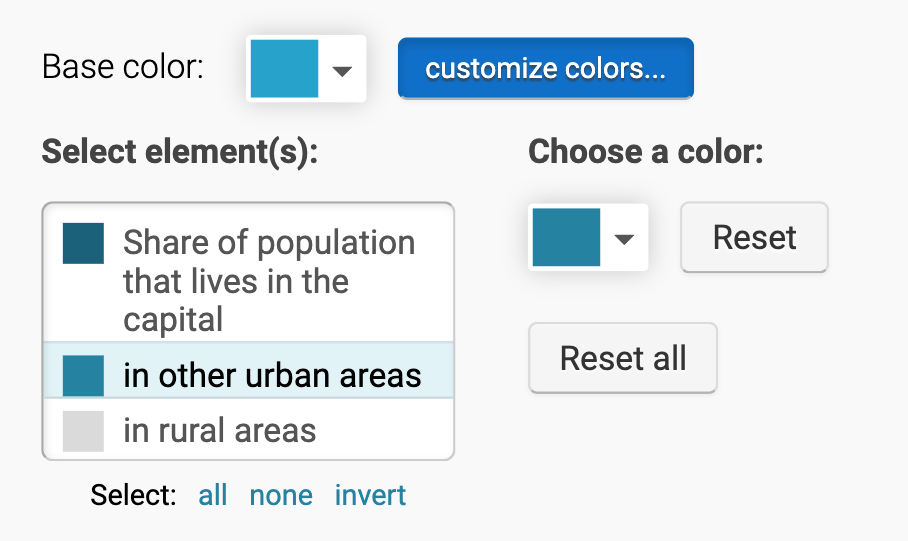
To change the color of our bars, we can use the feature "customize colors" in the app, like so:

To do the same with the API, we will add a new property to the JSON called metadata.visualize.custom-colors with another PATCH request:
curl  --request PATCH \
      --url https://api.datawrapper.de/v3/charts/`<ID>` \
      --header 'Authorization: Bearer <YOUR_TOKEN_HERE>' \
	    --header 'content-type: application/json' \
      --data \
     '{
        "metadata": {
          "visualize": {
            "thick": true,
            "custom-colors": {
              "in rural areas": "#dadada",
              "in other urban areas": "#1d81a2",
              "Share of population that lives in the capital": "#15607a"
     					 },
            }
        }
    }'
As you can see, we also set the thick-ness of the bar to true in the same request.
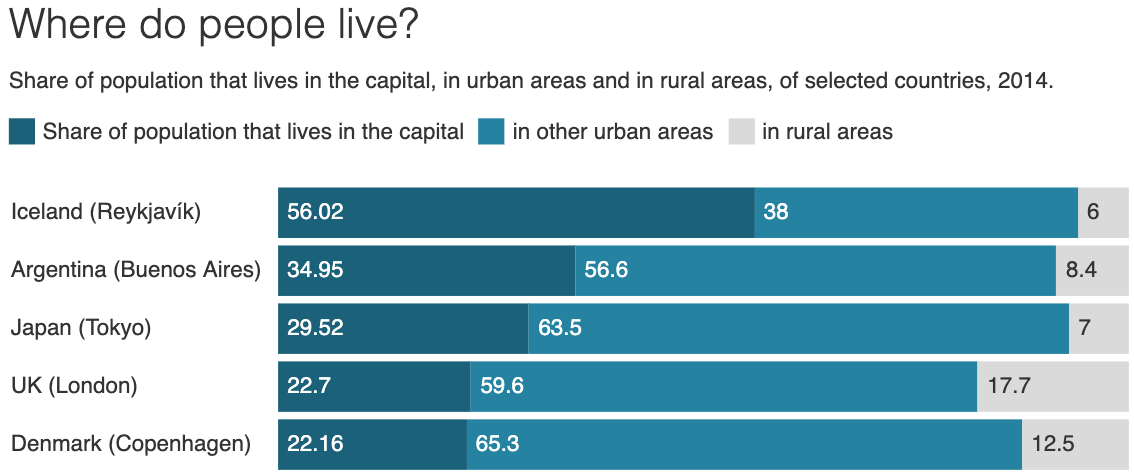
Now, our chart looks like this:

Publish the chart
To publish the chart, run the following request. Afterwards, you can check if the chart got published when opening the following URL: https://www.datawrapper.de/_/<ID>/. In both cases, make sure you replace <ID> with your own chart ID.
curl --request POST \
  --url https://api.datawrapper.de/charts/`<ID>`/publish \
      --header 'Authorization: Bearer <YOUR_TOKEN_HERE>'
Learn more about how to publish visualizations with the API and how to read the response to a publish query.
And that's it! We successfully published a chart.
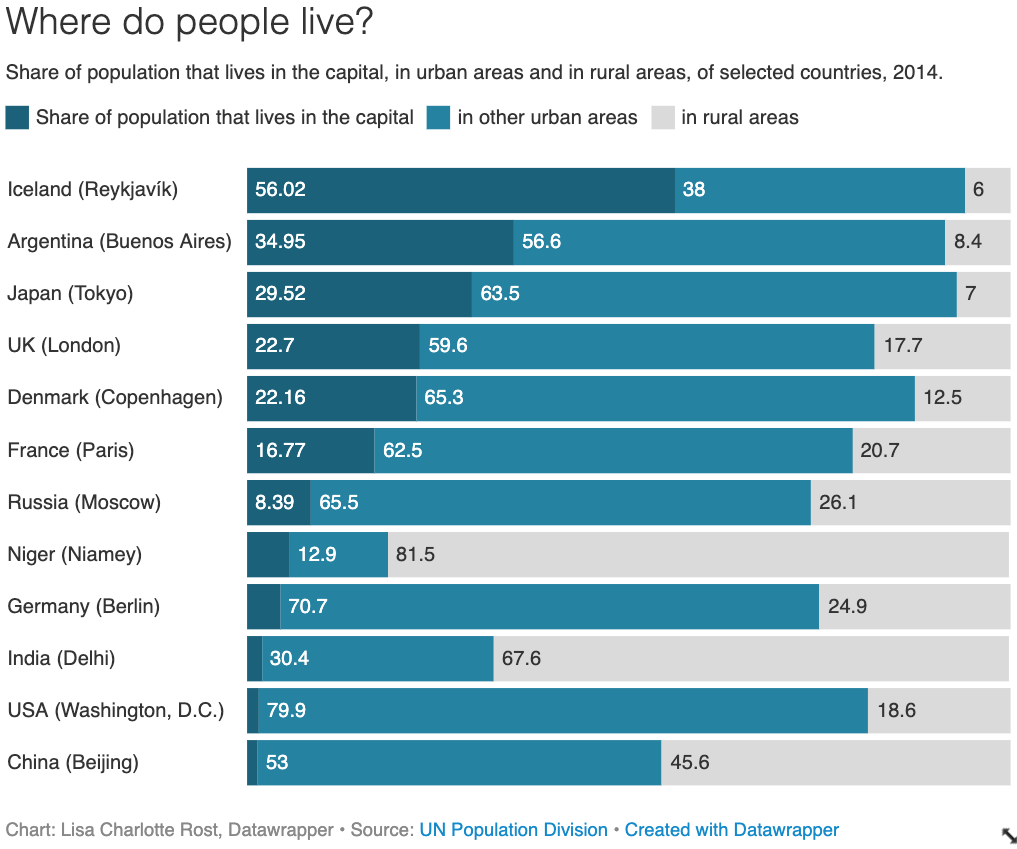
This is how our final chart looks:

Updated 8 months ago
