Creating a Locator Map
You need an API Access TokenEverything you need to follow this tutorial is a Datawrapper account and an API Access Token. Both are available for free. You can create an API Access Token with the click of a button in your Datawrapper settings. Learn how to do so in this article.

Besides symbol maps and choropleth maps, you can create locator maps in Datawrapper, using the same API endpoints that you use for charts. Locator maps are a great choice if you want to show where something is located or has happened. They don't require you to select a basemap: all you need is to decide on where to place markers and how to style them.
Creating a locator map
Let's start with a short POST request to create your map. To do so, define the visualization type in the API request. (Defining the title is not necessary, but it can't hurt.)
curl --request POST \
  --url https://api.datawrapper.de/v3/charts \
  --header 'Authorization: Bearer <YOUR_TOKEN_HERE>' \
  --header 'content-type: application/json' \
  --data '{ "title": "My locator map", "type": "locator-map" }'
This will give you back a response with your id. In our case, that's U2Dba. You should remember your map ID, because you will need it for many of your following API requests. For example, if your chart id was th4ns, you'll need to insert that in the examples below every time you'll see the placeholder <ID> – otherwise, your requests won't work.
Updating your map settings
Locator maps consist of two types of settings: markers, which contain the points, lines and areas you want to display on your map, and metadata, which controls settings like the view of the map and which layers are visible.
It makes sense to start by updating the metadata to ensure that your map shows the cut of the world that you want to be visible. Below is a minimal example of locator map metadata settings. This might look like a lot, but don't worry: you can leave most of these at their default settings, and we'll cover what exactly they control later on.
curl --request PATCH \
--url https://api.datawrapper.de/v3/charts/<ID> \
--header 'Authorization: Bearer <YOUR_TOKEN_HERE>' \
--header 'content-type: application/json' \
--data '{
"metadata": {
"data": {
"json": true
},
"visualize": {
"view": {
"center": [ -0.106, 51.523 ],
"zoom": 8,
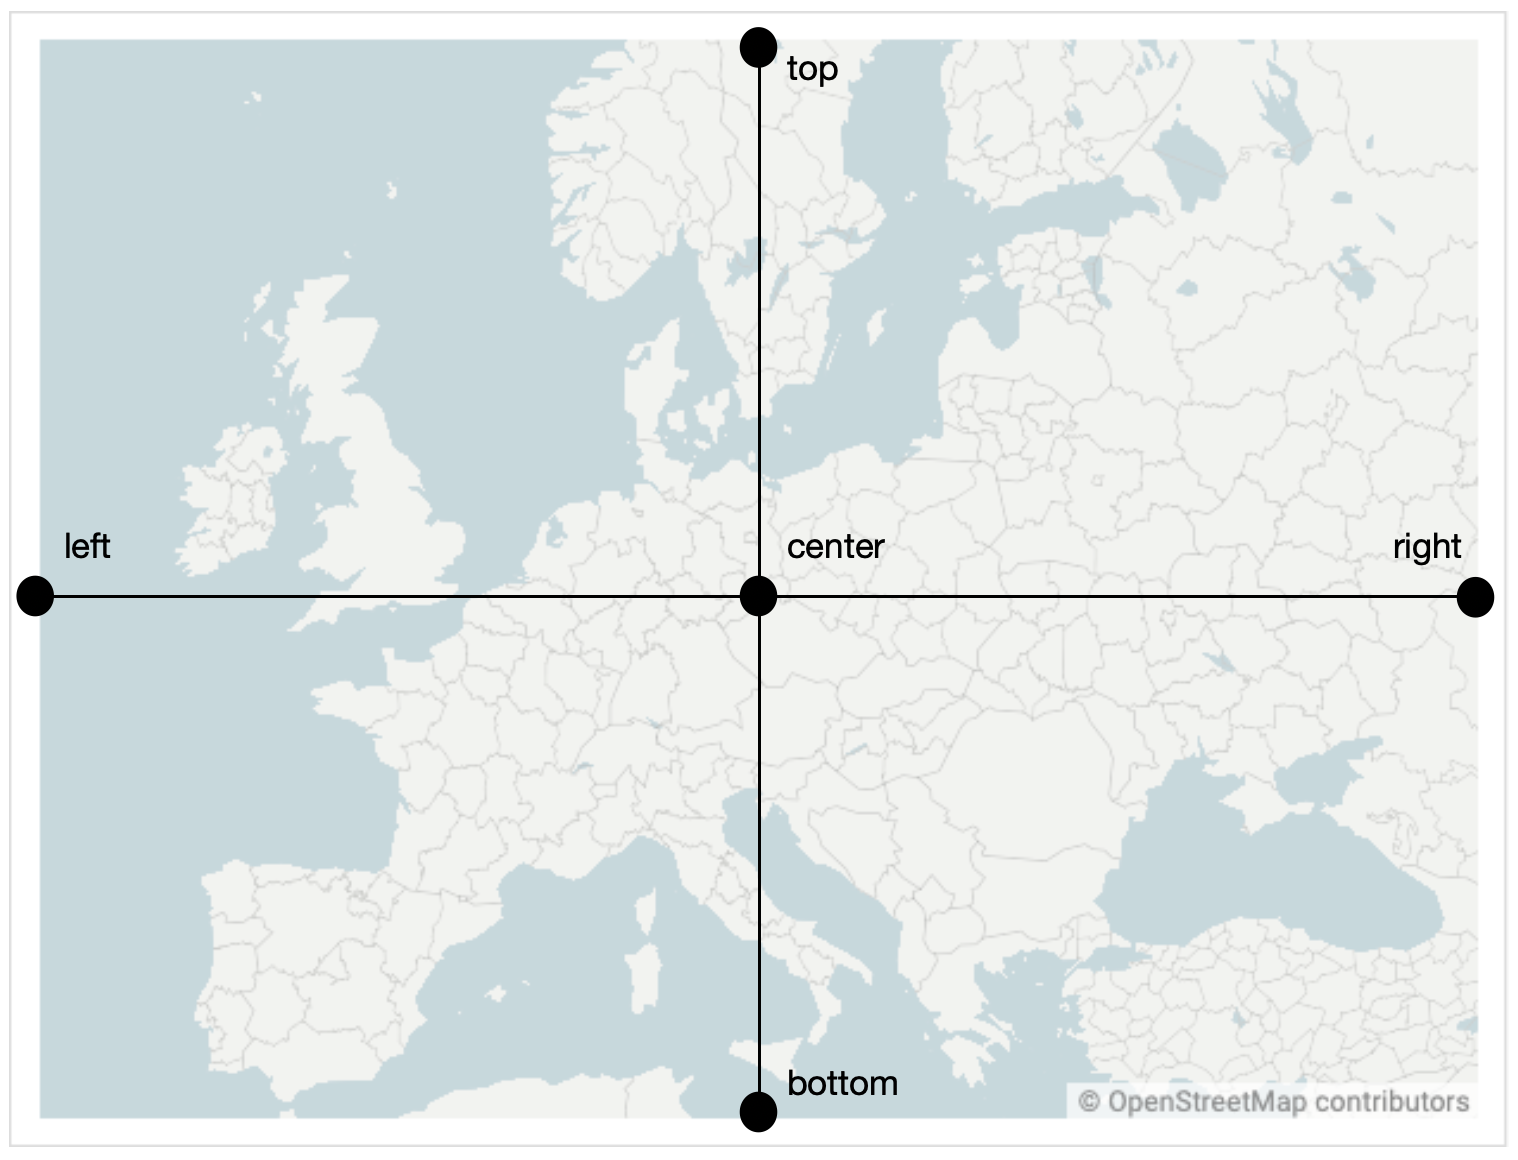
"fit": {
"top": [0.176, 53.408],
"right": [1.368, 51.779],
"bottom": [0.241, 51.1425],
"left": [-0.920, 51.754]
},
"height": 120,
"pitch": 0,
"bearing": 0
},
"style": "dw-light",
"defaultMapSize": 500,
"visibility": {
"boundary_country": true,
"boundary_state": true,
"building": true,
"green": true,
"mountains": true,
"roads": true,
"urban": true,
"water": true,
"building3d": false
},
"mapLabel": true,
"scale": false,
"compass": false,
"miniMap": {
"enabled": false,
"bounds": []
},
"key": {
"enabled": false,
"title": "",
"items": []
}
}
}
}'The most important thing in your map's metadata setting is the view object. It controls which part of the world your map will show, and at which zoom level. Specifically, it will allow you to define the following properties:
| Property | Purpose | Example value |
|---|---|---|
view.center | The center property contains a coordinate pair in the form of a lon/lat array that defines thecenter point of the map. | [ -0.792, 51.007 ] |
view.zoom | The zoom property contains the zoom level of the map, on a scale from 0 (the whole world) to 15). | 8 |
view.fit | The Why is there a | |
view.height | The height property contains the desired aspect ratio of the map in %. That means providing 100 as the height value will result in a quadratic map, and e.g. 50 would result in a 'landscape' view. | 100 |
view.bearing | The bearing property controls the rotation of the map, with 0 resulting in a north-oriented map. | 0 |
view.tilt | The tilt property allows you to tilt the map by a specified degree between 0 and 60. | 0 |
Some other important settings to control your map are the following:
| Property | Purpose | Example value |
|---|---|---|
style | The color scheme of your map. Valid options for the default Datawrapper theme are dw-light, dw-earth, dw-white and dw-white-invert, which correspond to the Map styles available in step 2 of the locator map editor. | dw-light |
mapLabel | This property controls whether you want to display automatically generated labels on your map. | true |
compass | This property controls whether you want to display a compass for orientation in the corner of your map. | false |
scale | This property controls whether you want to display a scale legend in the corner of your map. | false |
visibility | The visibility property contains an object that specifies which layers are displayed on your map. Each layer can be enabled or disabled as a boolean flag:
| { boundary_country: true, boundary_state: true, building: true, green: true, mountains: true, roads: true, urban: true, water: true, building3d: false } |
defaultMapSize | This option controls the default size at which the locator map will be displayed when opened in the Datawrapper editor. It does not have any impact on the display of your published map. | 500 |
Previewing your map
You can preview your map by logging into your Datawrapper account and opening it. This is how our map looks so far:

We can see our defined map view, but not much else so far! In order for our map to become useful, we need to add markers. To learn more about how to add markers to your map, have a look at these articles: